Paigo Documentation
  • Paigo Dashboard
  • 🏠Overview
    • Home
    • Getting Started with Paigo
    • Key Concepts
  • 💰SaaS Pricing
    • Pricing Basics
      • Product Items
      • Product Plans
    • Model Pricing Structure
      • Pay-as-you-go (Like EC2)
      • Subscription Tier
      • Custom Unit (Like Snowflake)
      • Seat-based Pricing
      • Top-Up Pricing (like OpenAI)
    • Manage Customer Profile
  • 🧩Usage Metering
    • Meter Usage Data at Scale
    • Usage Measurement Template
    • Manage Measurement
    • Infrastructure-based Method
    • Agent-based Method
    • API-based Method
    • Datastore-based Method
    • Configure IAM Role
  • 💳Invoicing and Payment
    • Issue Invoice
      • Automatic Line Item Formatting
    • Process Payment with Stripe
    • Cloud Marketplace Invoicing
    • Handle Tax and Compliance
  • Business Analytics
    • Business Analytics Overview
    • Usage-based Cost Insights
    • Profit Margin Analytics
    • Product Unit Cost
      • Unit Cost for Data Storage
      • Unit Cost for Kubernetes
    • Enable Business Analytics
  • Other
    • Sandbox
    • Customer Wallet and Credits
  • API
    • API Docs
Powered by GitBook
On this page
  • Overview
  • Ingest Usage Record with Dashboard

Was this helpful?

  1. Usage Metering

Meter Usage Data at Scale

PreviousManage Customer ProfileNextUsage Measurement Template

Last updated 1 year ago

Was this helpful?

Overview

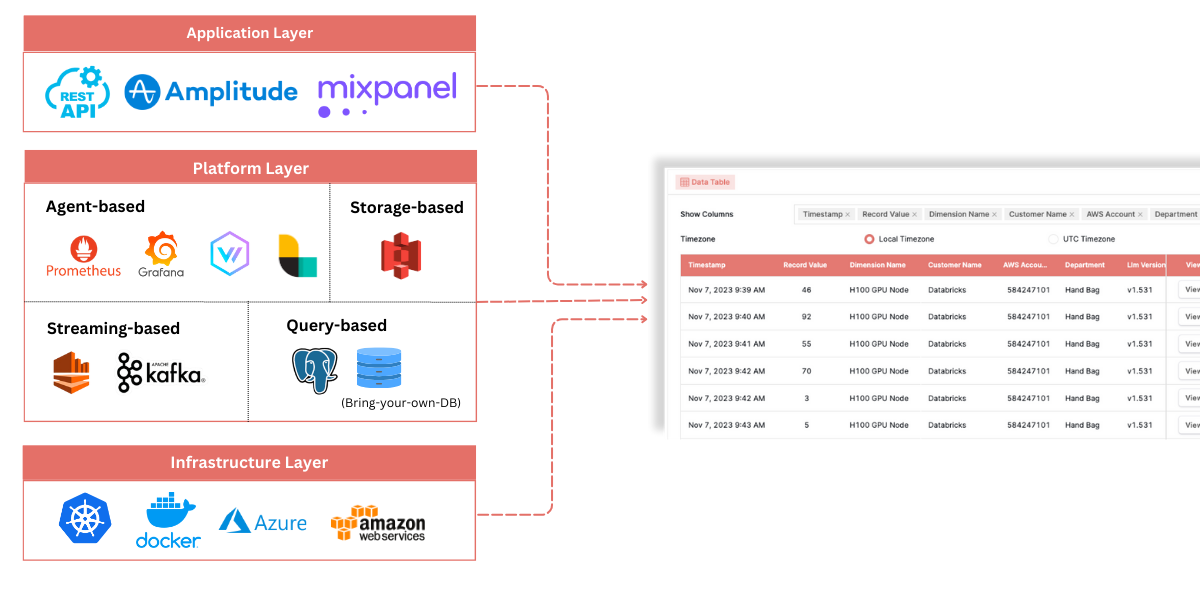
The most critical and fundamental steps to get started with usage-based billing and pricing are to measure accurate usage data and collect them for billing/pricing. Paigo does deep integration with SaaS application at every layer to extract usage out in real-time and keep track of the usage amount for the SaaS business.

The architecture diagram below shows how Paigo meteres product usage data from every layer of SaaS application stack:

The table below summarizes usage meter architecture:

Layer
Integration Method

Application

REST API, Amplitude, Mixpanel

Platform (Storage-based)

AWS S3

Platform (Streaming-based)

Confluent Kafka, AWS Kinesis

Platform (Query-based)

PostgreSQL, Bring-your-own-DB

Platform (Agent-based)

Prometheus, Grafana, Vector, Logstash

Infrastructure

AWS, Azure, Docker, Kubernetes

Ingest Usage Record with Dashboard

From Paigo Dashboard, usage data can be recorded without writing code. It is great for trying usage data ingestion and getting started with more programmatic way of usage data collection automation. To try creating usage record with dashboard, it is required to have a dimension and a customer profile created. See Getting Started with Paigo chapter for an example setup.

To ingest usage record, navigate to Customer tab and select a customer profile from the customer table. In the customer profile view, scroll down to Usage Monitoring widget. In the dropdown on the top right corner of the widget, select the dimension to record usage with, and click on the Record Usage button. In the Record Usage form, the fields of Customer ID, and Dimension ID, are all prefilled. Set value for the following fields with proper values:

  • Record Value: a numerical value represent the amount of usage

  • Timestamp: the time of when the usage record is measured. Usually it marks the end of the period when usage amount occurs.

  • Record Metadata (Key - Value Pair): additional metadata to be stored on the usage record, such as environment, purpose, owner, developer, contract number, or any arbitrary data to be associated with this usage record. Metadata can be used for analytics purpose in the future. Click on Add Metadata to add the key-value pair to metadata. Double click previewed Metadata table cells to edit added metadata, and press Enter to save the edits.

See the screenshot below for an example.

In the Preview Record Code Snippet section down below, the code to create the same usage record is provided. Click on the Copy button on the top right corner of Preview Record Code Snippet to copy the code. Click Submit button to submit the usage record.

🧩